The cost of takeaway food over the pandemic
Brendan Thompson • 15 October 2021 • 2 min read
This post is certainly going to be left of the field from what I would typically write about. Over the past week or so, I have started thinking about how much money I have spent over the past two years on takeaway food; truth be told, I have thought about looking into this a few times but never really wanted to know. I jumped over to my American Express account and pulled down all the available data, which unfortunately is only 18-months worth of transaction history. So, the chart I plotted only starts from April 2020. I was hoping to go back a bit further.
Below is the graph I produced of all my spending on; UberEats, DoorDash, Deliveroo and Mr Yum. I took it up to the date of this post, and grouped it by month as that seemed the most sensible way to group it.
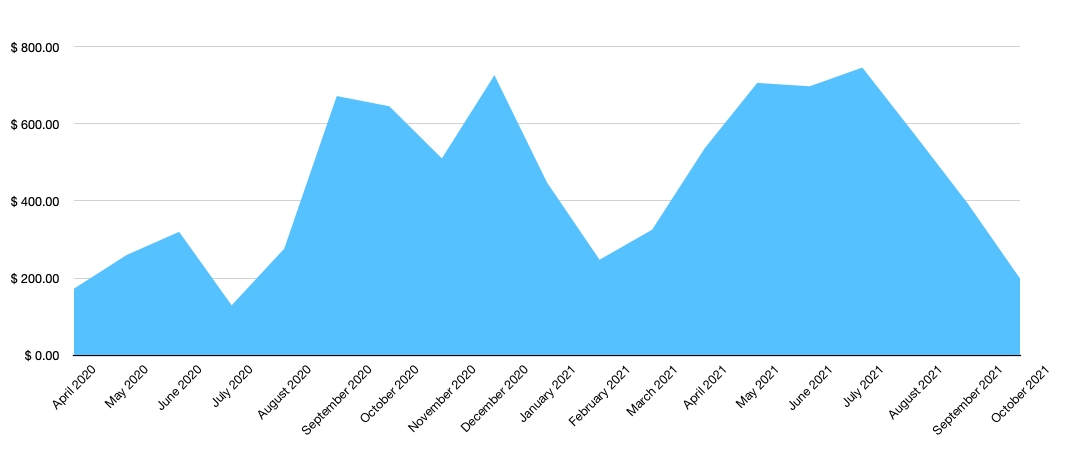
You can see that there are a few mountains and a few valleys. The overall trend here -at least until August 2021- is upwards. In that May to July 2020 time-frame restrictions were eased in Victoria which accounts for a drop in takeaway as I am confident I would have replaced that with eating out.
The interesting drop is from December 2020 to its lowest of 2021 in February, for the most part we were not really in lockdown and I was trying to be more healthy. And that sheer drop off from July 2021 onwards was me trying a lot harder to be healthier, making sure that I cook dinner more regularly.
I will continue to track this over the coming months to see if things change any more.